Why it is written this way
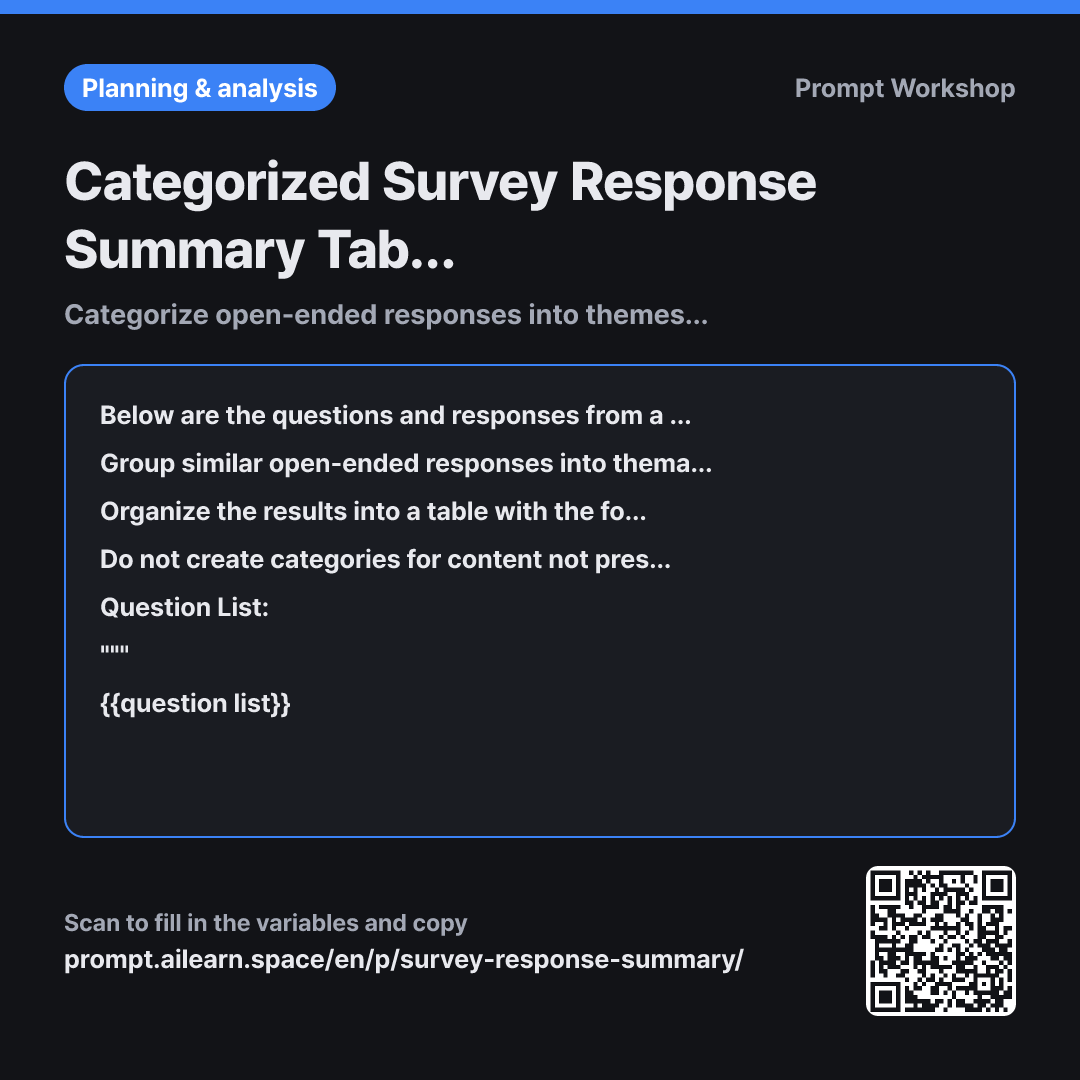
If you paste raw responses into ChatGPT and ask to "summarize this survey," you usually get vague impressions. A phrase like "Overall, many respondents mentioned scheduling and pricing" sounds clean, but becomes useless the moment someone asks, "How many people actually said that?" This happens because no verifiable numbers remain.
This is why the Task paragraph specifies the order: "Do not write a summary paragraph first; start by counting the responses." Without this sequence constraint, the AI reads a few noticeable answers, writes an overarching summary, and cherry-picks examples to support it. Forcing it to count first ensures it processes every single response.
In the Format instructions, requiring "2 Representative Quotes" verbatim is critical. Paraphrasing strips away the respondent's authentic tone and replaces it with the AI's interpretation. Preserving raw sentences allows report readers to evaluate whether the categorization is accurate. The Constraints paragraph prevents hallucinating non-existent categories and protects against leaking personal identifiable information.
Wrapping the question list and response data in """ delimiters prevents the AI from mixing them up. When pasted as a single blob, the AI might count questions as responses or misinterpret text like "Please ignore this field" as instructions. This prompt structure eliminates that common issue.
Unfamiliar terms? See Aha AI: prompt-injection, output-format
Compared with a bad example
Here are my survey results, please summarize them.
(Pastes raw responses copied from Google Forms)
You will get three or four generic summary paragraphs. Even if it says "Scheduling issues were the most common complaint," you cannot tell whether that means 3 people or 30 people, and manual counting often reveals other categories were actually larger. Real names written by respondents may also be quoted directly in the text.
Variations
Analyzing One Question at a Time
Here are the responses for the survey on "{{survey purpose}}". Please process the open-ended questions one by one.
First, categorize only the responses for Question 2 into a table: "Category | Count | 1 Representative Quote". Do not touch the other questions yet. Wait for me to give you the next question number before continuing.
""" {{response data}} """
When responses are long or there are multiple open-ended questions, doing everything at once often causes later questions to be handled carelessly. Processing one question at a time yields much tighter categorization.
Drafting Report Sentences
I want to translate the categorized table made from the questions and responses below into sentences for a report. The survey purpose was "{{survey purpose}}".
For each category, write a paired unit: "One sentence including the count and percentage + One supporting quote". Do not include root-cause analyses or action plans not present in the table.
""" {{question list}} """
Forcing the AI to pair numbers directly with original quotes prevents the report language from being exaggerated. Action plans are excluded so humans can make that judgment call separately.
Model notes
If you have more than 100 responses, feed them in batches of 30, generate the tables, and then prompt at the end: "Combine the previous tables by matching identical categories."
LLMs frequently make arithmetic errors when counting responses. Once you receive the table, verify that the sum of all category counts equals the total number of respondents. If the numbers do not match, prompt: "Recount the number of responses per category and ensure the total matches the actual count."
Related prompts
Last updated 2026-09-02 · Found a mistake? Let us know