Why it is written this way
When you paste sales figures and ask "analyze why sales dropped," language models tend to assert definitive reasons. Sentences like "The drop appears to be a combined result of seasonality and marketing budget cuts" sound plausible, but there is no way to verify them immediately. What you need from a sales analysis prompt is not a single presumed answer, but a prioritized list of candidate hypotheses to guide your upcoming investigation.
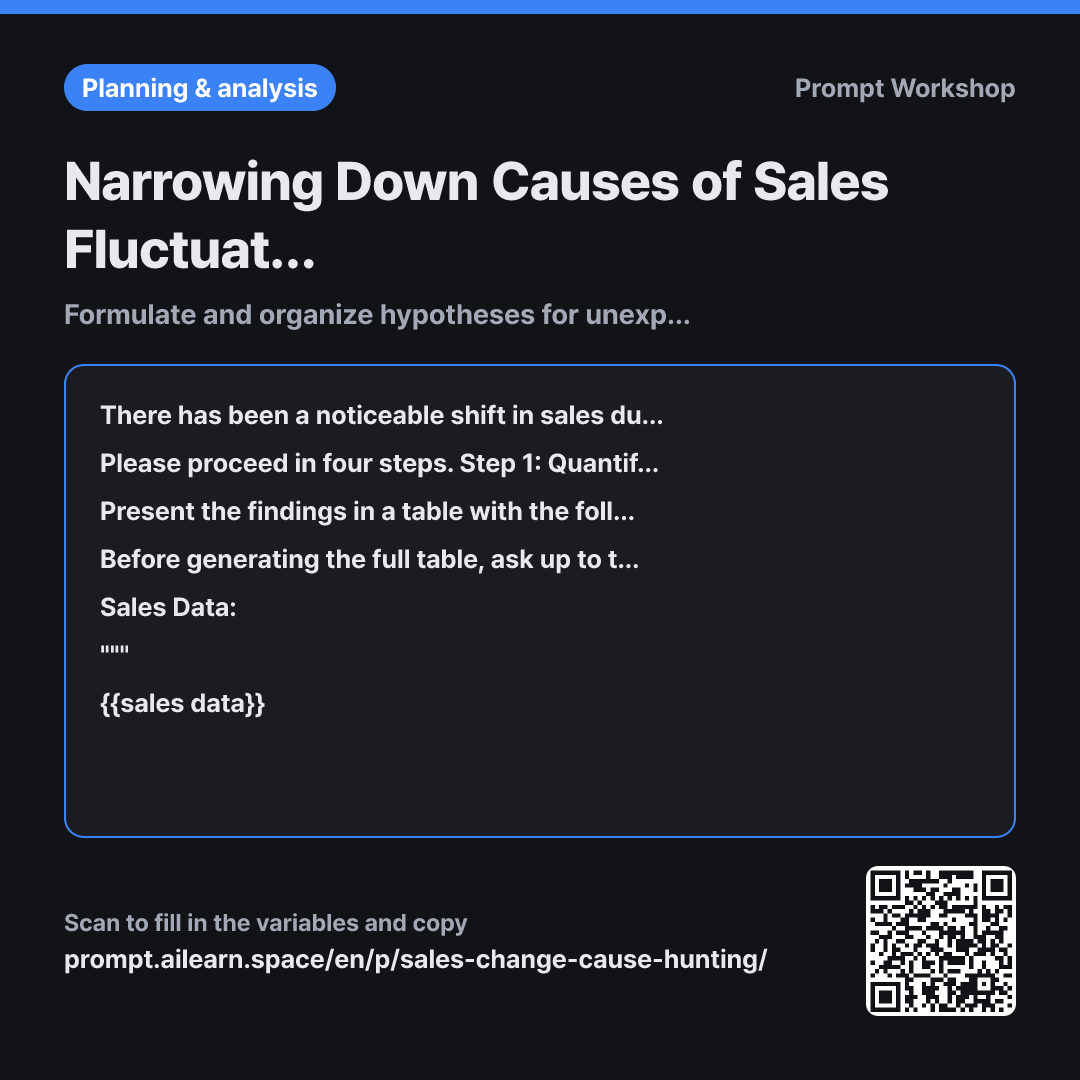
This is why the second paragraph breaks the workflow into four steps. Step 2—decomposing the revenue shift into order volume versus average order value (AOV)—is especially critical. Without this step, "revenue decreased" remains a vague macro issue where every speculative reason sounds plausible. If order volume held steady while AOV plummeted, the issue lies in pricing or product mix rather than top-of-funnel traffic, which fundamentally changes the candidate list.
In the third format paragraph, including a "Contradicting Evidence" column serves as the core anchor of this prompt. If asked only for supporting points, the model will rationalize every hypothesis until all five seem equally convincing. Forcing counter-evidence into the same table makes unviable hypotheses obvious. Meanwhile, the "Data Needed to Verify" column turns abstract speculation into concrete action items for meetings.
The fourth paragraph instructs the model to clarify key missing details upfront. The most common reason AI-generated sales diagnostics miss the mark is that the model is unaware of out-of-band context like inventory stockouts or payment gateway errors. Finally, wrapping the data and contextual events in separate """ blocks prevents the model from conflating qualitative notes with quantitative logs, keeping timeline cross-referencing precise.
Unfamiliar terms? See Aha AI: chain-of-thought, hallucination
Compared with a bad example
Our sales dropped significantly in August. Analyze why this happened.
(Paste sales table)
The response will be a generic list of three or four speculative paragraphs. You won't be able to evaluate the relative plausibility of each factor, and internal changes—like adjusting the free shipping threshold—won't even be factored in because they weren't provided. Untestable macro factors like seasonality or economic trends will dominate the explanation, while recent operational tweaks get ignored. Taking this output to a meeting will inevitably lead to the question: "So, what concrete action are we taking next?"
Variations
When Sales Spike Unexpectedly
Sales increased during the {{time period}}. The goal is to determine whether this growth is sustainable or a one-off spike. Break down the data into order volume and AOV calculations, then create a table listing up to three "Reasons It May Continue" and three "Reasons It May Be Temporary", each paired with specific evidence. Below the table, provide a two-line recommendation on what actions to repeat next month to sustain momentum.
Sales Data: """ {{sales data}} """
Events in Between: """ {{events in between}} """
Sudden revenue gains often escape rigorous scrutiny. This variant shifts the focus toward determining whether the growth is repeatable.
Three-Sentence Meeting Summary
Based on the data below, write a three-sentence summary of the sales changes during the {{time period}} for an upcoming meeting. The first sentence must state the quantitative change in revenue. The second sentence must identify whether order count or AOV drove the change. The third sentence must highlight what remains unverified and cannot be assumed yet. Avoid conclusive statements regarding the root cause.
""" {{sales data}} """
Use this when there is no time for a full hypothesis matrix. Fastening the third sentence to unresolved questions prevents premature assumptions from being presented as verified facts.
Model notes
Be sure to remove sensitive client names, account IDs, or staff details from the sales data before pasting. Period dates, monetary amounts, and transaction counts are sufficient to isolate the trends.
Related prompts
Last updated 2026-09-02 · Found a mistake? Let us know