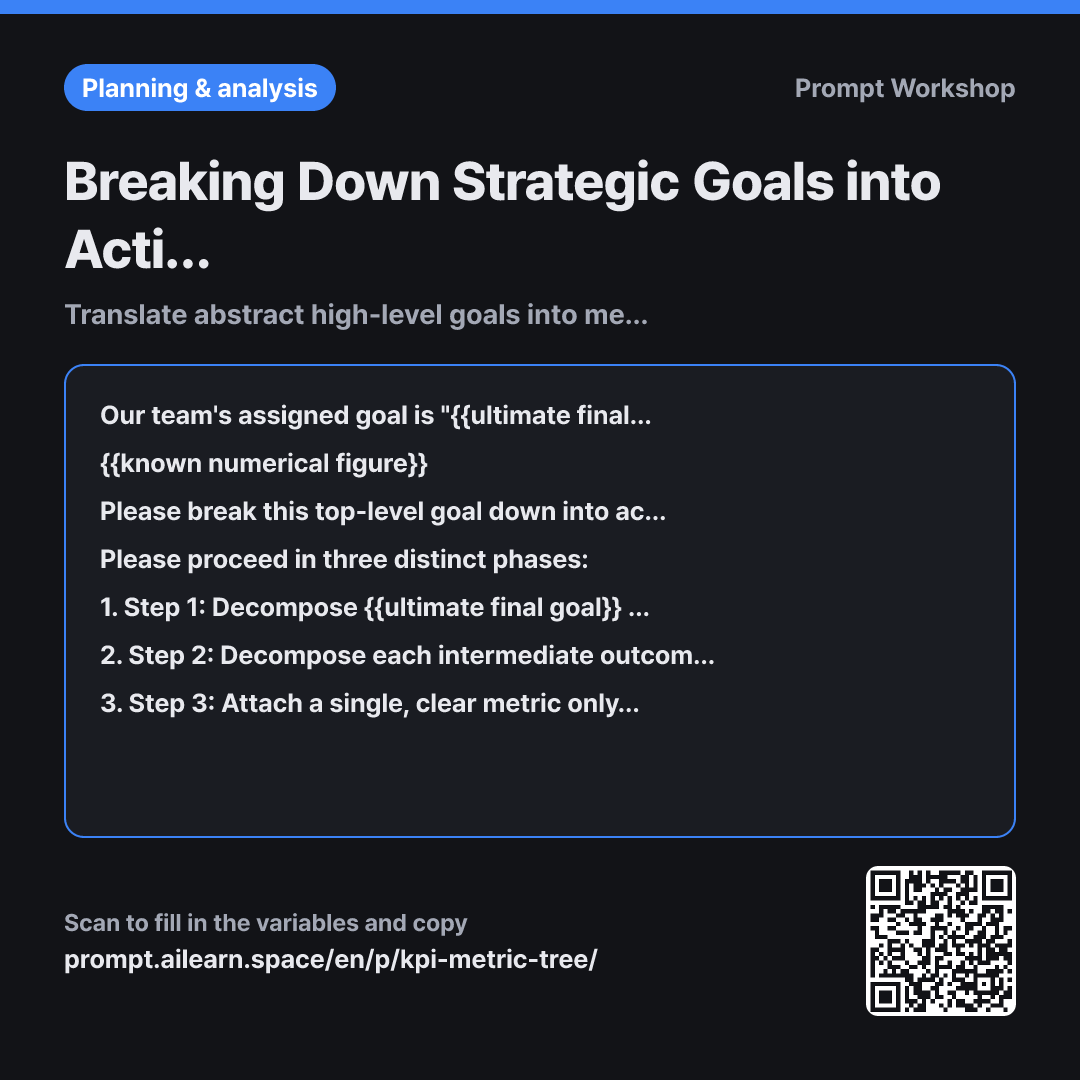
Breaking Down Strategic Goals into Actionable KPIs

Translate abstract high-level goals into measurable, actionable weekly metrics.

Prompt · 4 variables

Our team's assigned goal is "{{ultimate final goal}}" with a timeline of {{time period}}. The actual execution will be handled by {{responsible organization}}. Because the goal is currently just a single high-level sentence, we haven't established what to track on a weekly basis. Here are the baseline numbers we currently have: {{known numerical figure}}

Please break this top-level goal down into actionable metrics that our team can track every week. Do not immediately list generic KPIs; instead, decompose the goal systematically step by step, attaching specific metrics only at the final layer.

Please proceed in three distinct phases: 1. Step 1: Decompose {{ultimate final goal}} into 2–3 intermediate outcome components using a clear mathematical relationship (multiplication or addition, e.g., Result = Pool Size × Conversion Rate). 2. Step 2: Decompose each intermediate outcome further down to a level that {{responsible organization}} can directly control and influence through daily actions. 3. Step 3: Attach a single, clear metric only to each leaf-node item at this lowest actionable level.

Formatting requirements: First, present Steps 1 through 3 as an indented hierarchical list (with a one-line explanation for how each level was split). Then, create a summary table containing only the final actionable metrics. Table columns: Metric Name | Formula / Definition | Data Source Location | Current Baseline | {{time period}} Target | Tracking Cadence. - Populate the Current Baseline only from the figures I provided; if unavailable, do not leave it blank—explicitly mark it as "Not Tracked". - Below the table, select the top 3 core metrics to review every week, accompanied by a one-line rationale for each.

Constraints: Do not create metrics for factors that {{responsible organization}} cannot directly influence. Pure lagging indicators (like total top-line revenue or aggregate site visits) belong in Step 1, not in the final action table. Do not invent target numbers without justification; if data is missing, write "To be set after baseline measurement".

Copy, then paste here · ChatGPT and Claude open with the prompt filled in Open in ChatGPT ↗Open in Claude ↗Open in Gemini ↗ Edit in builder Download classroom card

Why it is written this way

Context
Our team's assigned goal is "{{ultimate final goal}}" with a timeline of {{time period}}. The actual execution will be handled by {{responsible organization}}. Because the goal is currently just a single high-level sentence, we haven't established what to track on a weekly basis. Here are the baseline numbers we currently have: {{known numerical figure}}
Task
Please break this top-level goal down into actionable metrics that our team can track every week. Do not immediately list generic KPIs; instead, decompose the goal systematically step by step, attaching specific metrics only at the final layer.
Steps
Please proceed in three distinct phases: 1. Step 1: Decompose {{ultimate final goal}} into 2–3 intermediate outcome components using a clear mathematical relationship (multiplication or addition, e.g., Result = Pool Size × Conversion Rate). 2. Step 2: Decompose each intermediate outcome further down to a level that {{responsible organization}} can directly control and influence through daily actions. 3. Step 3: Attach a single, clear metric only to each leaf-node item at this lowest actionable level.
Format
Formatting requirements: First, present Steps 1 through 3 as an indented hierarchical list (with a one-line explanation for how each level was split). Then, create a summary table containing only the final actionable metrics. Table columns: Metric Name | Formula / Definition | Data Source Location | Current Baseline | {{time period}} Target | Tracking Cadence. - Populate the Current Baseline only from the figures I provided; if unavailable, do not leave it blank—explicitly mark it as "Not Tracked". - Below the table, select the top 3 core metrics to review every week, accompanied by a one-line rationale for each.
Constraints
Constraints: Do not create metrics for factors that {{responsible organization}} cannot directly influence. Pure lagging indicators (like total top-line revenue or aggregate site visits) belong in Step 1, not in the final action table. Do not invent target numbers without justification; if data is missing, write "To be set after baseline measurement".

When asking AI for KPIs with a simple prompt like "Give me KPIs for my team," it typically outputs generic metrics like revenue, traffic, conversion rate, and customer satisfaction score. While none of these are wrong, they fail to clarify what the team should actually execute this week. Top-line revenue is an outcome shaped by multiple overlapping variables rather than a lever a team pulls directly; tracking only lagging outcomes leaves teams clueless about what to adjust when numbers drop.

This is why the second Task paragraph strictly prohibits simply listing KPIs out of the gate. Without this negative constraint, LLMs default to standard textbook KPI lists. The third paragraph breaks the process into three structured Steps, enforcing mathematical decomposition (such as Repeat Customers = Customer Pool × Repurchase Rate). Formulaic breakdowns ensure mathematical completeness without overlap or gaps (MECE), making trade-offs and focus areas explicit.

In the fourth Format paragraph, the "Data Source Location" column separates realistic, deployable KPIs from theoretical ones. Teams frequently define sound formulas that cannot actually be queried from any dashboard. Allowing a "Not Tracked" label exposes instrumentation gaps early, allowing team leaders to separate metric design from tracking infrastructure implementation.

Finally, the concluding paragraph filters out uncontrollable variables and limits the weekly review set to just three indicators. Tracking ten metrics leads to dashboard fatigue where none get monitored; focusing on three ensures consistent operational review during weekly standups.

Unfamiliar terms? See Aha AI: chain-of-thought, output-format

Compared with a bad example

Common bad example

Help me set KPIs for my team this year. The goal is doubling repeat customers.

Produces a generic list of standard metrics: Repurchase Rate, Customer Lifetime Value (CLV), Churn Rate, and Net Promoter Score (NPS). Because the relational logic connecting these metrics to daily actions is missing, the team won't know which lever to pull first. Targets will be filled with arbitrary numbers like "30% repurchase rate," with no data source specified, leaving the dashboard empty and abandoned by the first weekly review.

Variations

Auditing & Streamlining Existing KPIs

Auditing & Streamlining Existing KPIs

Below this line, I will paste the list of metrics our team currently tracks. Please explain the exact mathematical or causal link between each metric and our "{{ultimate final goal}}". For any metric that lacks a clear mathematical relationship, explain why it does not directly contribute. Additionally, identify any missing metrics necessary to achieve the target within {{time period}}, and flag any existing metrics that {{responsible organization}} cannot directly control.

Auditing and pruning existing metrics is often faster than building a framework from scratch. It immediately removes vanity metrics that do not roll up into core goals.

Creating a 1-Page Weekly Operational Review Template

Creating a 1-Page Weekly Operational Review Template

From the KPIs developed above, select only the top 3 critical metrics for {{responsible organization}} to monitor weekly, and design a 1-page dashboard template for our weekly operations meeting. For each metric, include: Current Week Value | Week-over-Week Trend | Remaining Gap to {{time period}} Target | Key Action Item for This Week (1 line). Also specify, for each metric, which secondary diagnostic sub-metric the team should inspect first if the primary metric deteriorates.

Designed for operational execution post-KPI setup. Pre-defining troubleshooting paths saves significant diagnostic time during meetings.

Model notes

Review the Step 1 mathematical decomposition first before accepting the downstream metrics. If the high-level equation is flawed, every downstream operational metric will be misaligned, making post-table corrections much harder.

Related prompts

Last updated 2026-09-02 · Found a mistake? Let us know