Why it is written this way
If you paste a table and simply ask "analyze this," the AI usually returns repetitive sentences stating the numbers. You get ten lines like "June had 1,240 signups and July grew to 1,310," which anyone reading the table already knows. A data analysis prompt should not just repeat values; it must narrow down what those values actually mean.
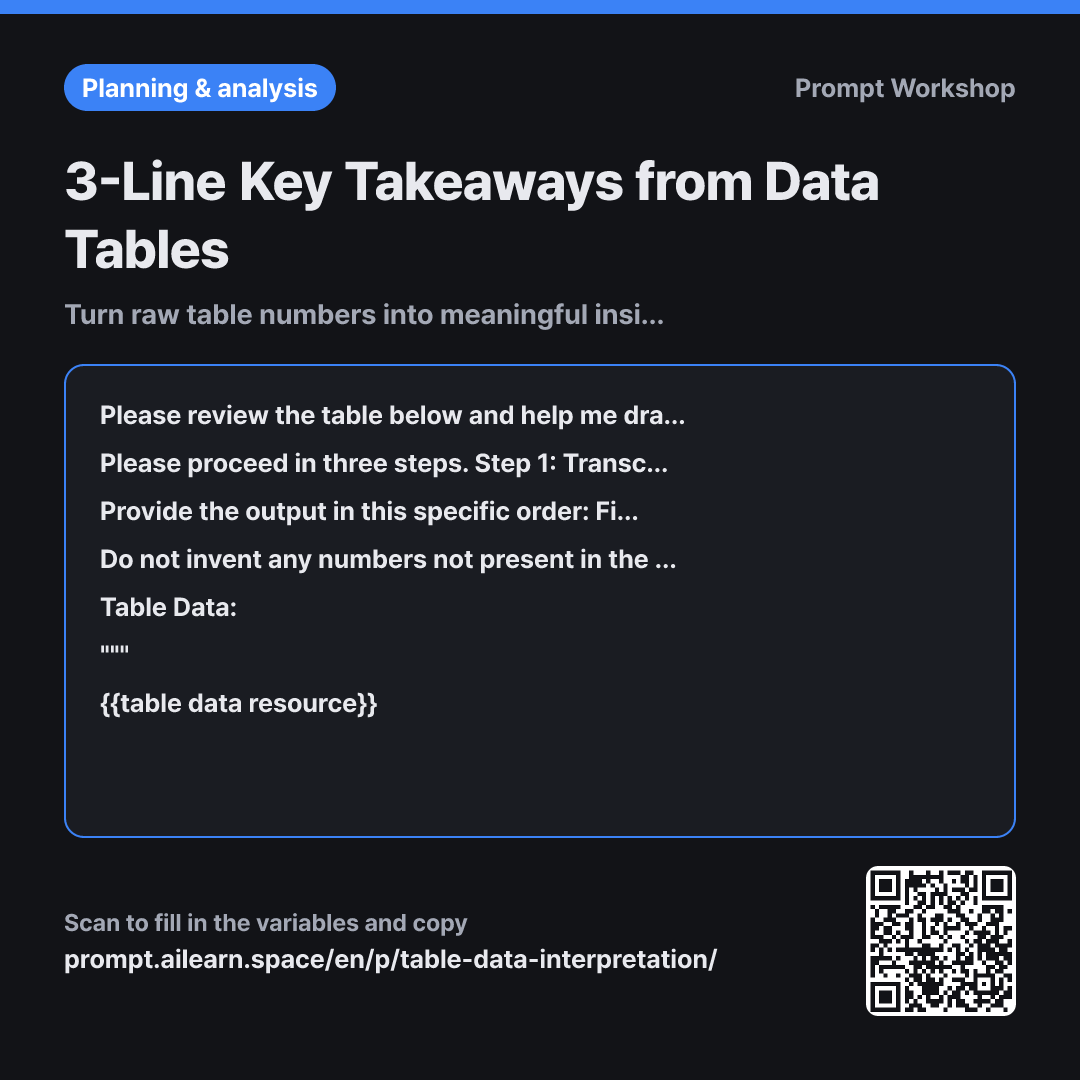
This is why the second paragraph breaks the work into three steps: transcribe changes, compute variances, and only then interpret. Requiring explicit formulas is crucial. When a model jumps straight to conclusions, it tends to use dramatic words like "surged significantly" when the actual increase is only 3%. Forcing calculations first prevents exaggerated claims.
In the third paragraph, the format constraints lock the takeaways to exactly three lines. Leaving the count open causes the model to list ten generic observations, leaving the human to sift through what matters. A three-line cap forces prioritization. The two lines of "Next Steps" ensure the analysis transitions into real action.
In the fourth paragraph, the constraints requiring "(Speculation)" prevent the most common pitfall in spreadsheet interpretation. If a table only shows conversion rates and the model adds "likely due to seasonal summer slump," the reader cannot tell if that comes from data or guesswork. Wrapping the table in """ ensures column headers are treated strictly as reference data, not instructions.
Unfamiliar terms? See Aha AI: output-format, hallucination
Compared with a bad example
Analyze this table for me.
(Pasted table from Excel)
You get a literal, row-by-row narrative description. The numbers are accurate, but without highlighting which shifts matter, you end up having to re-read the table yourself. Without explicit calculations, vague adjectives like "slight bump" or "sharp drop" appear, mixed with baseless assumptions about seasonality or competitors. Using this in a report makes it impossible to verify data sources later.
Variations
When answering executive questions quickly
Please review the table below and provide only the answers needed to {{viewing purpose}} in exactly three sentences. The first sentence must be the conclusion, the second sentence the comparison numbers and calculation relative to {{comparison criterion}}, and the third sentence what remains unverified. Do not include anything outside the table.
""" {{table data resource}} """
This strips out tables and heavy formatting, leaving just three concise sentences. Ideal when you need quick answers during a meeting.
When screening for anomalies first
Please scan the table below and find potential data anomalies first. Look for values with mismatched digits compared to other rows, columns with mixed units, empty cells, and unexplained outliers compared to {{comparison criterion}}. List up to five suspicious values in a table, adding a one-line explanation for why each is questionable. Do not provide interpretation yet.
""" {{table data resource}} """
Use this when data validation is needed before interpretation. Correcting flagged values before running the main prompt ensures your conclusions are sound.
Model notes
If the pasted table's columns appear misaligned, add a line: "Please re-render this table as a markdown table before starting." Copying from spreadsheets often turns tabs into spaces, causing alignment shifts.
Related prompts
Last updated 2026-09-02 · Found a mistake? Let us know