Why it is written this way
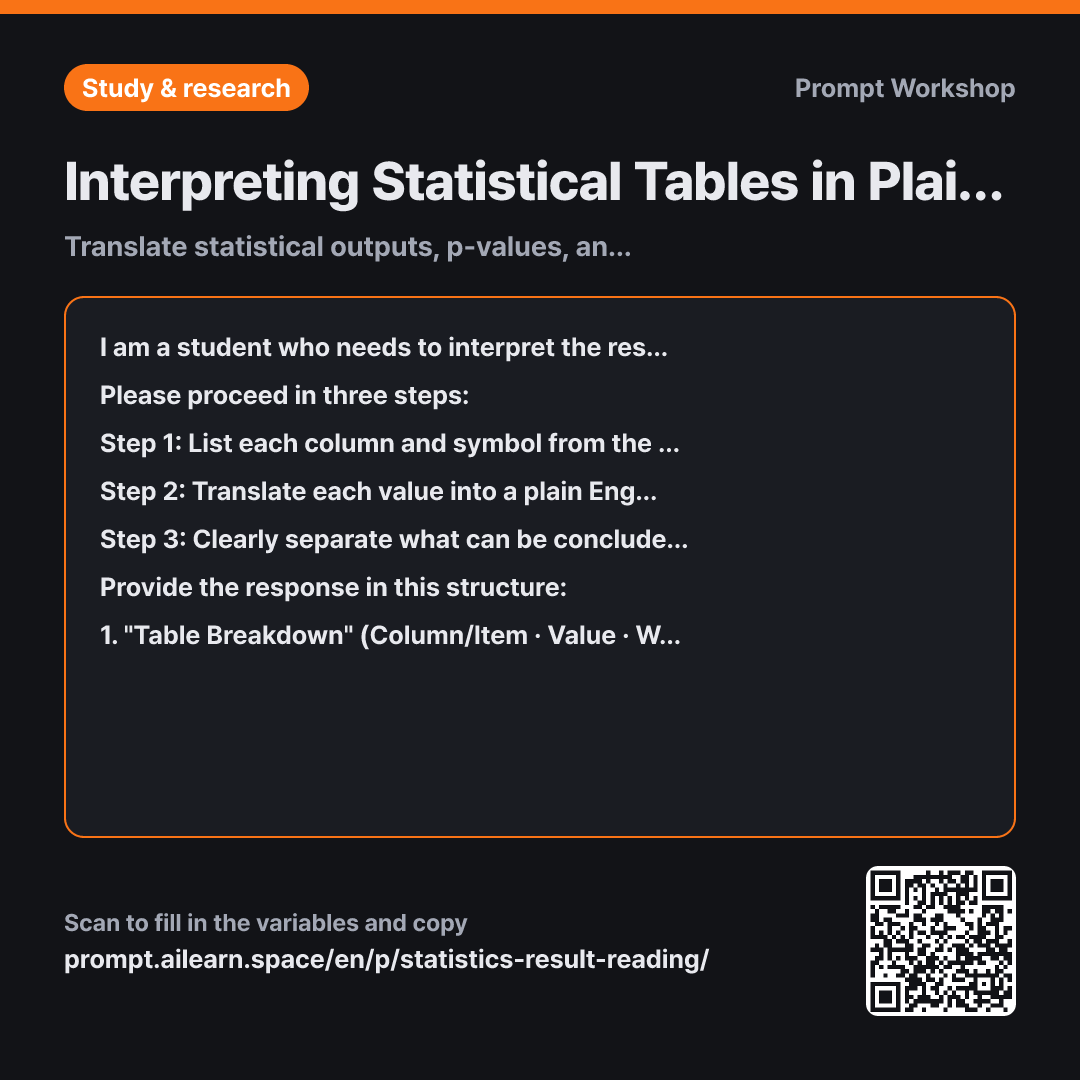
When asking an AI to interpret a statistics table without constraints, it often returns speculative claims rather than a direct translation of the data—such as "Study hours significantly affect grades, so increasing study time is effective." The latter recommendation is outside the scope of the table. A regression output only indicates covariance or statistical association under specific model assumptions, not verified real-world policy outcomes. This prompt keeps the AI strictly within the boundary of the data.
The second paragraph enforces a three-step breakdown because skipping directly to narrative synthesis frequently leads to misinterpretations. Forcing the AI to list the symbols and raw numbers in Step 1 catches common errors immediately (like confusing unstandardized B with standardized β). Separating data translation from the model's limitations ensures that speculative conclusions do not blur into factual reporting.
The fourth paragraph sets key constraints that directly address common pitfalls in AI-generated statistical analysis: omitting the significance threshold, over-claiming causality, or conflating effect magnitude with statistical significance (e.g., misinterpreting a tiny p-value in a huge sample as a large real-world effect).
Enclosing the data inside triple quotes (""") prevents variable labels, footnote asterisks, and messy tabular formatting from being parsed as instructional text by the model.
Unfamiliar terms? See Aha AI: hallucination, step-by-step
Compared with a bad example
Interpret this regression result for me:
Variable B SE β t p Study Hours 0.287 0.061 .34 4.70 <.001 Sleep Hours 0.112 0.078 .11 1.44 .152
While this prompt generates a fluent paragraph, it frequently weaves in unverified claims. For instance, Sleep Hours (p = .152) might be described as "having no effect," when it actually means the sample failed to detect a statistically significant association at standard alpha levels. Because data facts and model assumptions blend together, you will struggle to defend the methodology when questioned.
Variations
Anticipating Defense or Presentation Questions
I am preparing to present the results of this {{analysis method}}. Please do not write an interpretation summary. Instead, generate 8 potential questions that an examiner, reviewer, or professor might ask upon reviewing this table.
For each question, indicate which specific value in the table prompted it, and categorize whether the question can be answered strictly using this table or if it requires additional statistical analyses.
Results Table: """ {{results table}} """
Use this when preparing for a thesis defense or conference presentation. Identifying unanswerable questions in advance gives you time to run necessary follow-up analyses.
Data Sanity Check & Anomaly Detection
Please review the following {{analysis method}} results table for potential anomalies or reporting issues before I proceed with interpretation.
Identify up to 5 potential flags in a structured table format, focusing on: non-standard notation, unexpected signs (+/-) or decimal scales, internal inconsistencies between related statistics, or missing standard metrics. Provide a one-sentence rationale for each flagged item. Do not interpret the findings yet.
Results Table: """ {{results table}} """
Useful for catching transcription errors or misaligned columns from statistical software exports before spending time on full interpretation.
Model notes
Attach your file first, then paste the prompt.
When uploading statistical tables as images, character recognition errors can occur with small decimal points and symbols. Verify that the values extracted in Step 1 match your original output before relying on the subsequent interpretation.
Related prompts
Last updated 2026-09-02 · Found a mistake? Let us know